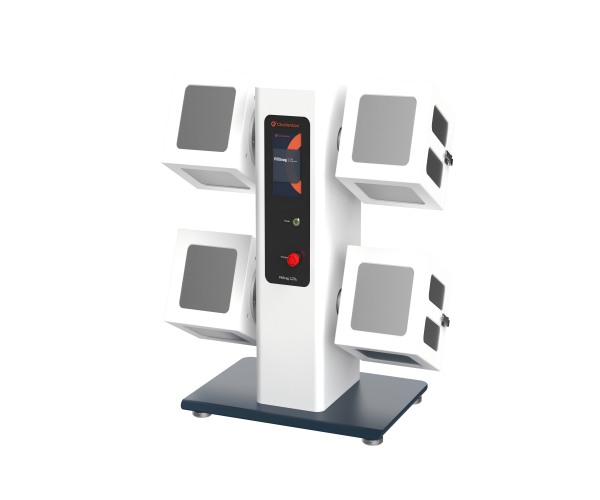
Pilling is a common problem in knitted fabrics. It affects how they look and traps dirt. This reduces wear performance and leads to a bad experience for consumers. The ICI pilling box method tests how well wool and other knitted fabrics resist pilling. In the ICI pilling test method, the specimen goes into a polyurethane tube. It tumbles in a cork-lined wooden chamber without a specific direction. We keep a constant rotational speed for a set number of cycles. This process creates friction and piling.
Research on fuzzing and pilling performance looks at several key factors. These include fiber properties, yarn traits, fabric structure, and finishing methods. The upkeep of testing tools and accessories also impacts the final pilling assessment. This study looks at how testing conditions affect knitted fabrics. It focuses on specimen tubes, cork liners, and instrument rotation speed. The goal is to find out how these factors affect fuzzing and pilling through experiments.
1 Experimental Section
1.1 Test Specimens
The team selected five knitted fabric specimens for testing. To reduce rating errors, we selected all specimens from dark-colored fabrics. These fabrics had a pilling grade between 2 and 4. Table 1 shows the specifications and parameters.
Table 1 Fabric Specimen Specifications
| Sample Number | Composition | Yarn Count/Nm | Fabric Structure |
| 1# | 50% Wool / 50% Cotton | 54/2 | Plain weave |
| 2# | 30% Wool / 70% Acrylic | ||
| 3# | 100% Wool | ||
| 4# | 100% Cashmere | ||
| 5# | 50% Wool / 50% Cashmere |
1.2 Instruments
Pilling Box Tester: ICI Pilling and Snagging Tester, with an adjustable rotation speed of 20 r/min to 70 r/min. Shore A Durometer; LX-A, measuring range 0-100 HA. Polyurethane Specimen Tubes: Group A: New tubes, unused; Group B: Aged tubes, 2 years old; Group C: Aged tubes, 6 years old.
1.3 Experimental Design
1.3.1 Experiment 1
Effect of Tumbling Box Rotation Speed on Fuzzing and Pilling Grade. The ICI pilling box tester was set to rotation speeds of 30 r/min and 60 r/min. The team tested specimens #1 to #5 for the specified number of tumbling cycles. Two evaluators tested the fuzzing and pilling performance. Then, they conducted a visual assessment. The evaluators determined the final test results as the average rating.
1.3.2 Experiment 2
Effect of Cork Liners on Pilling Grade. We used the same ICI pilling box tester for our tests. Different cork liners had various friction coefficients and hardness levels. Each specimen underwent 14,400 revolutions. We measured the weight of each specimen before and after testing. Two evaluators conducted a visual assessment of the fuzzing and pilling performance. The evaluators determined the final test results as the average rating.
1.3.3 Experiment 3
Effect of Specimen Tubes on Pilling Grade. We tested specimens #1 to #5 using the same ICI pilling box tester. They used polyurethane tubes from Groups A, B, and C. Two evaluators looked at how well they fuzzed and pilled. The evaluators determined the final test results as the average rating.
2 Results and Analysis
2.1 Effect of Tumbling Box Rotation Speed on Fuzzing and Pilling Grades
2.1.1 Impact of Test Cycles on Fuzzing and Pilling in ICI Pilling Test
Table 2 shows the results of Experiment 1. Table 2 shows that the fabric’s fuzzing and pilling change as pilling cycles increase. The piling grade ranges from 0 to 1.
2.1.2 Effect of Rotation Speed on Pilling Grades and Friction Dynamics
Table 2 shows that the ICI pilling ratings changed a lot as the test cycles went up. The ICI pilling box test works by placing the specimen on a polyurethane tube. The specimens then tumble in the box for a set number of cycles. This process creates fuzzing and pilling. During the test, the mounted specimens rolled and bumped inside the box. This makes the surface fibers expand and become fuzzy. This friction leads to entanglement and the formation of pills. As cycles increase, friction affects the specimen’s surface. The fibers linking the pills to the specimen stretch and break. This causes the pills to fall off. Fibers that do not fall off become tangled due to static electricity. If pills form faster than they detach, fuzzing and pilling grades drop further. Table 2 shows that an increase in the number of test cycles has a minor impact on the results.
2.1.3 Influence of Fabric Properties and Pill Formation on Test Results
Table 2 shows that specimens tested at 30 r/min have a lower pilling grade than those tested at 60 r/min. The rotation speed of the ICI piling box has a significant impact on the piling grade of the specimens. The friction time between the specimen tubes and cork liners is greater at a speed of 60 r/min. This happens even with the same total number of rotations. The results change at different rotation speeds, but they do not follow a clear pattern. Also, the differences between specimens are inconsistent. The pilling box test works by placing the specimen in a polyurethane tube. It tumbles unpredictably in the box. This process creates fuzzing and pilling. The final test results depend on more than the number of test cycles and rotation speed. They also relate to the fabric’s properties and the process by which pills are formed.
Table 2 Test Results for Fabric Fuzzing and Pilling at Two Speeds and Durations
| Sample | Pilling Cycles60r/min | Pilling Cycles30r/min | |||||||
| 7200r(2h) | 10800r(3h) | 14400r(4h) | 7200r(4h) | 10800r(6h) | 14400r(8h) | ||||
| 1# | 4 | 4 | 3 | 2.5 | 2 | 2 | |||
| 2# | 3 | 3 | 2.5 | 2 | 1.5 | 1 | |||
| 3# | 3.5 | 3 | 3 | 2.5 | 2.5 | 1.5 | |||
| 4# | 3.5 | 3 | 2.5 | 2 | 2 | 1.5 | |||
| 5# | 3.5 | 3.5 | 3 | 2.5 | 2 | 2 | |||
2.2 Effect of Cork Liners on Pilling Grade
Table 3 shows the test data from Experiment 2.
Table 3 Effect of ICI Pilling Box Cork Liner Conditions on Pilling
| Sample Number | Old Cork Liner | New Cork Liner | |||
| Pilling/Grade | Weight Loss Rate/% | Pilling/Grade | Weight Loss Rate/% | ||
| 1# | 3.5 | 1.579 | 3 | 3.020 | |
| 2# | 3.5 | 1.370 | 1.5 | 1.400 | |
| 3# | 3 | 0.855 | 2 | 0.940 | |
| 4# | 3.5 | 1.476 | 2.5 | 1.253 | |
| 5# | 4 | 1.152 | 3 | 1.203 | |
The test data in Table 3 show that all specimens lost weight after both tests. The mass loss was greater in the box with new cork liners than in the one with old cork liners. Different cork liners showed clear differences in the pilling results.
2.2.1 Impact of Cork Liner Condition on Mass Loss in ICI Pilling Test
Cork liners are an important friction medium in fuzzing and ICI pilling tests. The “Calibration Specification for ICI Pilling Box Tester” defines the friction coefficient for the cork liner in the standard JJF (Textile) 053—2013. The original friction coefficient of the liner must be at least 0.5. Also, during testing, the friction coefficient for the cork liner should not drop below 0.5. Table 4 shows the performance of new and old cork liners in Experiment 2.
2.2.2 Friction Coefficient Standards and Their Role in Pilling Performance
Table 4 shows that both the new and old cork liners have friction coefficients in the standard range. A big difference in these coefficients causes noticeable changes in the piling grade. Results can vary by as much as 2 grades. The specimens showed big differences in weight loss before and after testing. Cork liners consist of cork particles mixed with rubber. They provide strong compression resilience and good friction properties. In the pilling box test, the rotating box causes rolling friction. This happens between the specimen and the cork liner. This friction makes fibers stick out from the fabric surface. As the test progresses, fibers form pills, which then detach, leading to weight loss. A higher friction coefficient in the cork liner means more force on the fibers. This leads to more pills forming on the specimen.
2.2.3 Influence of Cork Liner Hardness on Pilling and Test Consistency
Table 4 shows that the old cork liner is 80 Shore A in hardness. The rating of the new cork liner is 60 Shore A, which makes it softer. This change happens as wool fibers soak up oils and finishing agents over time. Silicones and fatty acids help the fabric feel softer and more comfortable. These substances can stay on the cork liner due to long contact during the test. This makes the surface smoother. As a result, the friction coefficient goes down, but the hardness increases. When the cork liner becomes harder, it contacts the specimen for less time while rotating. This means less friction and fewer pills form, leading to higher pilling grades. The hardness and friction of the cork liner in the pilling box affect how much the samples fuzz and pill. Changes in cork liner properties can cause fuzzing and pilling results to vary. This inconsistency can affect tests done in the same lab or different labs.
Table 4 Performance Test Results of Cork Liners
| Item | New Cork Liner | Old Cork Liner | |||||||||||
| Side A | Side B | Side C | Side D | Side E | Side F | Side A | Side B | Side C | Side D | Side E | Side F | ||
Hardness (Shore A) | 1 | 60 | 61 | 60 | 61 | 62 | 59 | 80 | 80 | 82 | 82 | 79 | 80 |
| 2 | 60 | 58 | 62 | 61 | 60 | 59 | 79 | 81 | 79 | 79 | 79 | 80 | |
| Mean | 60.2 | 80.0 | |||||||||||
| Friction Coefficient | 1 | 0.8 | 0.8 | 0.8 | 0.8 | 0.7 | 0.8 | 0.5 | 0.5 | 0.6 | 0.5 | 0.6 | 0.5 |
| 2 | 0.8 | 0.8 | 0.8 | 0.8 | 0.8 | 0.8 | 0.5 | 0.5 | 0.5 | 0.6 | 0.6 | 0.5 | |
| Mean | 0.8 | 0.5 | |||||||||||
2.3 Effect of Specimen Tubes on Pilling Grade
Figure 1 shows the test data from Experiment 3.
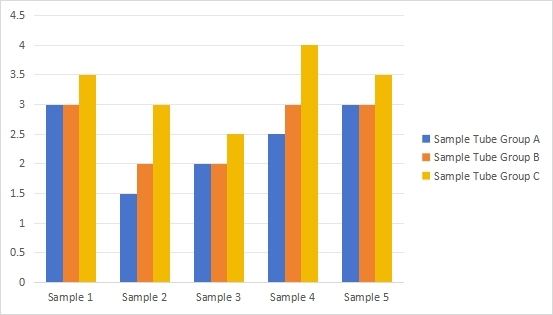
Figure 1 Pilling Grades of Specimen Tubes with Different Ages
2.3.1 Effect of Specimen Tube Hardness on Pilling Test Results
The test results in Figure 1 show big differences in piling ratings. This is after we did fuzzing and pilling tests at the same rotation speed and number of cycles. Specimens that lasted less time had worse pilling than those that lasted longer. The biggest difference was between specimens 2# and 4#. Group A and Group C had a 1.5 grade difference. This difference affects whether the specimen passes the fuzzing and pilling test. The remaining specimens 1#, 3#, and 5# showed differences ranging from 0 to 0.5 grades. The specimen tubes impact the fuzzing and pilling test results in various ways. The team measured the hardness of the three groups of specimen tubes, and Table 5 shows the test data.
2.3.2 Impact of Specimen Tube Aging and Elasticity on Pilling Performance
Table 5 shows that as the service life of the specimen tubes increases, the hardness value goes up. This means the tubes become less elastic. You need to conduct the test at a steady temperature and humidity using the ICI pilling box method. The polyurethane specimen tubes are key items that this area uses often. High humidity and constant temperatures can cause PU molecules to break apart. This leads to aging signs, such as reduced mechanical strength and color changes. The performance deterioration has a direct correlation with usage time. Group C is 10.5 Shore A harder than Group A. Figure 1 shows that the new tubes are softer. They also have more fuzzing and pilling compared to the older, harder tubes. The effect on pilling varies across different samples.
2.3.3 Role of Test Conditions and Equipment Calibration in Ensuring Reliable Pilling Results
In the ICI pilling box test, the specimen sits on the tube. It rotates with the box, causing random, brief contact between specimens. As the specimen tube rotates, it feels different forces. In Figure 2, you see gravity, sliding parts, and friction from the incline. It also shows the forces between the tubes (Fx). When you apply force to a specimen tube, harder materials deform less under pressure. The contact time and area between the tubes decrease. This means the force on the specimens lasts for a shorter time and covers less space. This leads to less fuzzing and pilling and a higher pilling grade. This conclusion shows that how hard the specimen tube is impacts fuzzing and pilling grades in various ways. To ensure reliable test results, testers should focus on important aspects. They need to check the rotation speed of the equipment, the cork liner, and how well the specimen tube works. The team should check the equipment at regular intervals. This helps keep it calibrated. It helps spot issues, reduce measurement errors, and keep data stable and reliable.
Table 5 Hardness Measurement Results of Three Sample Tube Groups
| Number of Measurements | Group A (Shore A) | Group B (Shore A) | Group C (Shore A) | |||||||||
| A1 | A2 | A3 | A4 | B1 | B2 | B3 | B4 | C1 | C2 | C3 | C4 | |
| 1 | 50 | 51 | 49 | 52 | 54 | 53 | 52 | 53 | 62 | 60 | 63 | 61 |
| 2 | 49 | 52 | 48 | 52 | 53 | 52 | 54 | 54 | 65 | 62 | 62 | 60 |
| 3 | 52 | 52 | 51 | 51 | 53 | 55 | 52 | 55 | 59 | 60 | 62 | 60 |
| Mean | 50.8 | 53.3 | 61.3 | |||||||||
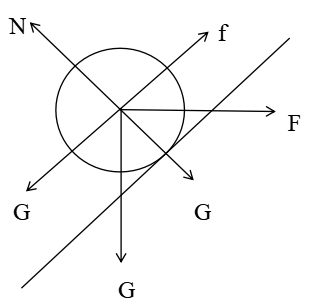
Figure 2 Schematic Diagram of the Forces Acting on the Specimen Tube During Box Rotation
3 Conclusion
This study, through the design of experiments, has reached the following conclusions:
3.1 Impact of Box Rotation Speed on ICI Pilling Test Results
The difference in box rotation speed has a significant impact on the pilling results. A slower box rotation speed leads to more fuzzing and pilling, resulting in a lower pilling grade.
3.2 Role of Cork Liner Hardness and Friction in Pilling Formation
The hardness and friction coefficient of the cork liner are important. They affect how much the specimen fuzzes and pills. As hardness decreases and the friction coefficient increases, fuzzing and pilling become worse. This leads to a lower piling grade.
3.3 Effect of Specimen Tube Aging on Pilling Performance
The aging of the specimen tubes leads to a decrease in the elasticity of the tube, resulting in a change in hardness. Lower hardness in the polyurethane tube leads to more fuzzing and pilling. This results in a lower piling grade.
Testers should control the box rotation speed during the test. They must also watch for changes in the specimen tube and cork liner. Replacing these parts on time is important.
In the next phase, the study will look at how the friction force changes. It will focus on the size of the rounded corners at both ends of new and old specimen tubes. The study will also explore how box cleanliness affects fuzzing and pilling results. This will give better data to help set instrument structure and test parameters. This is important for revising standards in the future.
