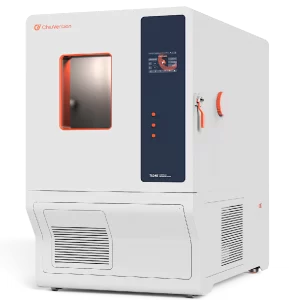
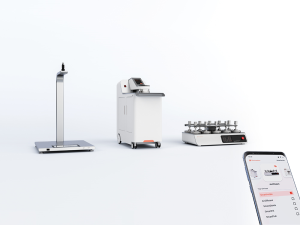
Textile testing refers to the quality and performance of textile products with physical and chemical methods in accordance with the relevant standards for qualitative or quantitative inspection tests and making test reports.
The standard specifies the physical and sensory items with environmental requirements, which must comply with the relevant requirements of temperature and humidity, standard illumination, and odor assessment of environmental conditions. The cotton color grade test, color fastness rating, pilling rating, appearance rating test, and yarn blackboard dry rating test environment must use a dedicated space to ensure that the rating results are not affected by other light sources in the adjacent area, the test environment to comply with the standard illumination, the test room wall color requirements. In this article, we will discuss the selection of standard atmospheres for textile testing, as well as specimen preparation and the processing of test data.
Standard atmospheres for testing and selection
The physical and mechanical properties of textiles often change with the testing environment (atmosphere temperature and humidity), and in order to obtain comparable results, the standard atmosphere for testing must be specified in advance when testing these properties.
Standard GB 6529-2008 refers to the provisions of the international standard ISO 139:2005, the textile test with the standard atmospheric conditions as shown in Table 1-6.
Table 1-6 Standard atmospheres for textile tests
| Item | Standard
temperature/°C |
Temperature
tolerance/℃ |
Standard relative humidity/% | Relative humidity tolerance/% |
| Standard atmosphere | 20 | ±2 | 65 | ±4 |
| Tropical Standard Atmosphere | 27 | ±2 |
65 |
±4 |
| Specific Standard Atmospheres |
23 |
±2 |
50 |
±4 |
Except in special cases, for example, wet tests, the physical and mechanical properties of textiles shall be tested in accordance with the provisions of the standard atmosphere for the test. In tropical or subtropical regions, the tropical standard atmosphere shall be used. For arbitration tests, the provisions of the standard atmosphere shall be used.
Specimen preparation and specimen wetting and pre-wetting
The specimen is prepared from the sample obtained by sampling in accordance with the prescribed method for testing. When preparing the specimen, its representativeness should also be considered. Generally, it is necessary to avoid blemishes, creases, or uneven parts, and not to be cut within 1m of the ends of the cloth and within 1/10 of the width of the cloth edges. The specified number of specimens should also be taken in such a way as to avoid the appearance of the same warp, weft, or coils in the same horizontal or vertical rows and columns. The quality of textile materials varies with different moisture regain rates.
In order to meet the needs of textile materials trade and inspection, the state has made uniform regulations on the moisture regain rate of various textile materials, which is called the common moisture regain rate. The national standard GB 9994-2008 stipulates the nominal moisture regain rate of major textile materials, see Table 1-7.
Table 1-7 Nominal moisture regain of major textile materials
| Textile materials | Nominal moisture regain/ % | Textile materials | Nominal moisture regain/ % |
| Cotton, Cotton Yarns, Cotton Sewing Threads
|
8.5 | Cashmere yarn | 15.0
|
| Cotton fabrics | 8.0
|
Rabbit hair, camel hair, yak hair | 15.0
|
| Homogeneous washed wool | 16.0
|
Ramie, Flax
|
12.0
|
| Heterogeneous washed wool | 15.0
|
Jute
|
14.0
|
| Recycled wool
|
17.0
|
Hemp, Robusta, Sisal
|
12.0
|
| Oil Wool
|
19.0
|
Mulberry Silk, Quercus Silk
|
11.0
|
| Worsted Wool
|
16.0
|
Acetate fibre
|
7.0
|
| Woolen yarn
|
15.0
|
Nylon 6, Nylon 66
|
4.5
|
| Woolen fabrics
|
14.0
|
Polyester
|
0.4
|
| Fleece, knitted fleece
|
15.0
|
Acrylic fibre
|
2.0
|
| Shaggy Woolen Fabrics | 16.0
|
Viscose fibre, rich fibre,cupro-ammonia | 13.0
|
| Combed cashmere | 17.0 | fibre Vinylon
|
5.0
|
| Combed waste wool | 16.0 | Polypropylene, Chlorine
|
0.0
|
| Dry Wool | 18.25 | Spandex | 1.3 |
For blends consisting of several types of fibers, the MTRR can be calculated as a weighted average of the blending ratio and the MTRR of the blended fibers, using the formula below:
W- the nominal moisture content of the ith fibre in the blend;
P- the dry blend ratio of the ith fibre in the blended material.
When the sample is in contact with the test atmosphere, it absorbs moisture from the atmosphere releases moisture to the atmosphere, and reaches the equilibrium moisture regain rate under certain atmospheric conditions. The lower the temperature of the atmosphere, the higher the relative humidity, the higher the equilibrium rate of return. As the equilibrium moisture content of a sample changes, so do its properties (e.g. mass, elongation, abrasion resistance, thermal, optical, electrical, etc.). Therefore, before testing the physical and mechanical properties of textiles, the specimen should be placed in a prescribed test atmosphere for a certain period of time to allow air to flow freely through the specimen in order to equilibrate the moisture content of the specimen with that of the standard atmosphere, a process known as humidification. Unless otherwise specified in the test method, the endpoint of equilibration is usually determined by freely exposing the specimen to the standard atmosphere (101.3 kPa) until the specimen does not vary by more than 25 percent of the mass in successive weighings at 2-h intervals. In some cases, humidification equilibrium may be considered to have been reached if the sample does not vary by more than 0.1 percent in successive weighing at 30-min intervals. However, in case of dispute, the former should prevail.
Since most textiles have hygroscopic hysteresis, even if the specimen is placed in a standard atmosphere for a long period of time so as to reach the moisture adjustment equilibrium, different equilibrium retention rates (the hygroscopic equilibrium retention rate is smaller than that of the exothermic equilibrium retention rate) will be formed due to the fact that the specimen is either hygroscopic or exothermic, thus affecting the results of the test. For this reason, the moisture balance of textile specimens is standardized as the hygroscopic balance.

Thus, for the wetter samples, in order to avoid the formation of the exhumation equilibrium in the humidification, it is necessary to carry out the pre-drying treatment, also known as pre-conditioning. Pre-conditioning is the first wet specimen placed in a relative humidity of 10% to 25%, the temperature does not exceed 50℃ in the atmosphere (such as oven), after a certain period of time, so that the specimen humidity is reduced to the nominal moisture content below the treatment process.
Specimen preparation generally refers to the conditioning of the textile specimen prior to testing and the pre-conditioning that may be required. However, when the specimen is contaminated with oils and surfactants, pastes, synthetic resins, etc., which have been added during processing and thus affect the results of the moisture conditioning or characterization of the specimen, these adhesions must be removed by means of an appropriate method and selection of a suitable solvent, which is known as specimen preparation or specimen decontamination. Therefore, specimen refinement is also an important part of specimen preparation.
The control of the test environment and the preparation of the specimen, together with scientific sampling and processing of the test results, are the basis for ensuring the accuracy of the results of textile quality analyses and tests.
Specimen Test Data Processing
Random specimen testing, to get a certain determination of the measured value, that is, test data. Do a number of tests, you get a set of data, that is, a set of measured values. Measured value can be divided into two categories of numerical data and measured value data. The former refers to only obtaining non-negative integer data, such as the number of defective pieces, the number of fabric defects, etc.; the latter refers to the value of the data that can be taken continuously, such as the strength of the fiber, the length, density and so on. The basic method of data collation is the list and charting, the distribution of test data from the distribution table or distribution chart can be more clearly seen in the nature of the change rule, but in practice, it is very inconvenient to use. If you can use a few simple figures can be the main characteristics of the distribution of carved out, it is much more convenient and can be solved with the help of mathematical methods. In mathematical statistics, it is common to use a few numbers called characteristic numbers to represent the distribution of a batch of data and its main characteristics.

Commonly used features can be divided into two categories: one is the centralized features, and the other category is called discrete characteristics.
Centralized features reflect the central position of the distribution, that is, most of the data concentration or the average data, such features are mainly the mean (X), median (Me), the number of people (M0), etc..
The other category is known as discrete characteristics, which reflect the degree of dispersion of the distribution, that is the fluctuation of the data, and these characteristics are mainly extreme deviation (R), mean difference (MD), variance (б²) or mean square deviation (б), coefficient of variation (CV), and so on.
Want to keep learning more testing-related articles in the field of textiles to broaden your knowledge base? Don’t forget to subscribe to our page! We will keep updating per week.


